Re: Huh? What is this?
URL: http://friam.383.s1.nabble.com/Huh-What-is-this-tp7599690p7599712.html
Hi, Tom,
I guess I have to confess that I don’t see why you found it so offensive. I feel like a damned fool asking you, but maybe “damned fool” is my role on this list and I should play it with joy and conviction. Please explain, as to a child.
Nick
Nicholas Thompson
Emeritus Professor of Ethology and Psychology
Clark University
https://wordpress.clarku.edu/nthompson/
From: Friam <[hidden email]> On Behalf Of Tom Johnson
Sent: Tuesday, December 1, 2020 12:33 PM
To: The Friday Morning Applied Complexity Coffee Group <[hidden email]>
Subject: Re: [FRIAM] Huh? What is this?
Nick:
I attached the image of the front page. You should be able to see it on your computer. As I said, it seems to be the year's worst data viz of the year.
T
============================================
Tom Johnson - tom@...
Institute for Analytic Journalism -- Santa Fe, NM USA
505.577.6482(c) 505.473.9646(h)
NM Foundation for Open Government
Check out It's The People's Data
============================================
On Tue, Dec 1, 2020 at 11:25 AM <[hidden email]> wrote:
Tom,
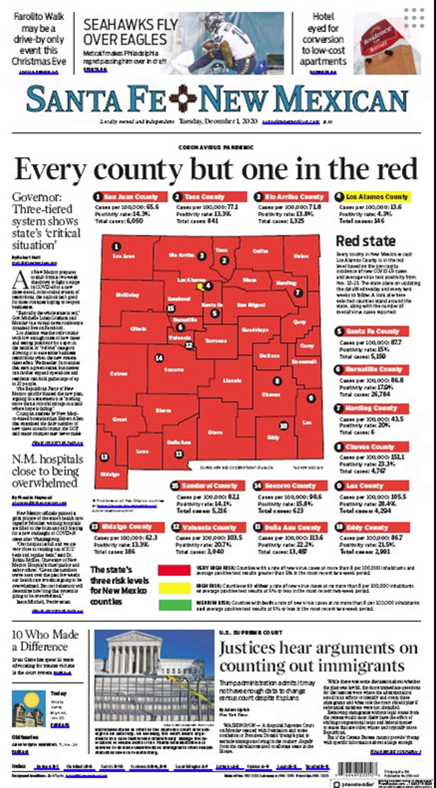
I only read the webedition, and so don’t have the front page in front of me, but the message seemed clear to me. BE AFRAID. If we are learning one lesson from this pandemic, it is that lack of fear is the primary driver of rising case numbers. Public policy has relatively little effect unless it increases fear. And robust terror makes public policy unnecessary. What did you NOT see that I did see?
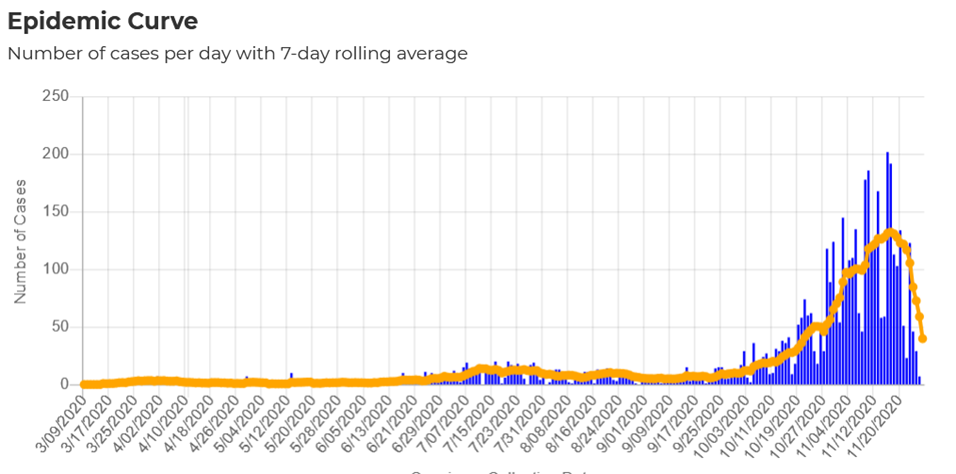
My candidate for the worst graphic is below.
Looking at this I would assume that we are out of the woods. In fact, the current rolling 7-day average is about 140 cases, more that 10 times what it should be. I think the downward tail of the graph reflects only incomplete data.
I have been frustrated by the state’s web page because it seems to emphasize cumulative cases at the expense of current cases and new cases per population.
Another bizarre data point appeared in the Gating criteria yesterday, where the current Ro was given as 0.97!
I think the City needs to run fumigation trucks up and don the streets or city workers with back packs and nosles . They could be just emitting water vapor, perhaps with a little corotene thrown in for dramatic effect?
Nick
Nicholas Thompson
Emeritus Professor of Ethology and Psychology
Clark University
https://wordpress.clarku.edu/nthompson/
From: Friam <[hidden email]> On Behalf Of Tom Johnson
Sent: Tuesday, December 1, 2020 10:34 AM
To: Friam@redfish. com <[hidden email]>
Cc: Mike Collins <[hidden email]>; Steve Ross <[hidden email]>; Steve Doig <[hidden email]>; Peter St. Cyr <[hidden email]>; Tom Scharmen <[hidden email]>
Subject: [FRIAM] Huh? What is this?
Below is this morning's front page of the Santa Fe New Mexican. It is obviously trying to give the virus story big play. But I can't figure out what in hell this map and all its appendages are trying to tell me. I might be missing something big time, but shouldn't this be nominated as the worst data visualization of the year?
============================================
Tom Johnson - tom@...
Institute for Analytic Journalism -- Santa Fe, NM USA
505.577.6482(c) 505.473.9646(h)
NM Foundation for Open Government
Check out It's The People's Data============================================
- .... . -..-. . -. -.. -..-. .. ... -..-. .... . .-. .
FRIAM Applied Complexity Group listserv
Zoom Fridays 9:30a-12p Mtn GMT-6 bit.ly/virtualfriam
un/subscribe http://redfish.com/mailman/listinfo/friam_redfish.com
archives: http://friam.471366.n2.nabble.com/
FRIAM-COMIC http://friam-comic.blogspot.com/
| Free forum by Nabble | Edit this page |