Pandemic Over!
URL: http://friam.383.s1.nabble.com/Pandemic-Over-tp7597342.html
June 15 has come and gone... and perhaps it is worth stopping to see if the "Pandemic is Over"... of course, by the stated definition, perhaps there never was a Pandemic, and Data and Science(tm) are prone to misrepresentation and use.
However...
This graphic is fascinating. Thank you Merle!
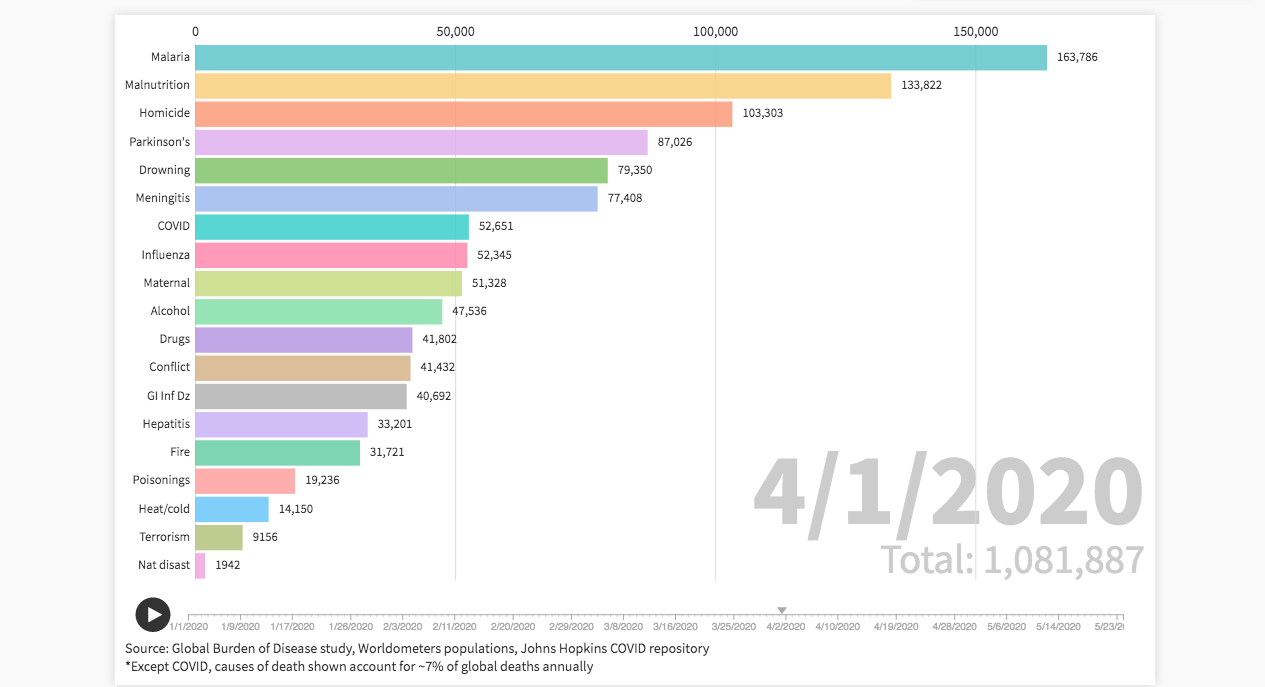
The live/interactive version has a very visually compelling
impact when you run the time-slider from January 1 to the end of
May. Since it is a common myth that "COVID19 is no worse than the
seasonal influenza", I thought I'd check to see when the number of
deaths from one caught up with the other.
It went past me the first time that the date of that "overtake"
was April Fools day. Of course, my conspiracy homunculus (one of
many tuned to those channels), jumped right up and called this an
"easter egg" put there by George Soros-funded liberal
pinko-flagwaver data scientists. A useful comparison for a
related homunculus might be to compare that day to the day of the
year the average taxpayer quits working for uncle Sam and gets
down to the business for "working for mysself, gall-durnit!". I
think that is a tough day to estimate given how many were out of
work, on unemployment, getting stimulus checks, paid by PPP
loan/grants by their small business employers, etc. I'm betting
that by the first stimulus check a huge number of people had been
paid more for the year than they paid in?!
From RT.LIVE on June 20
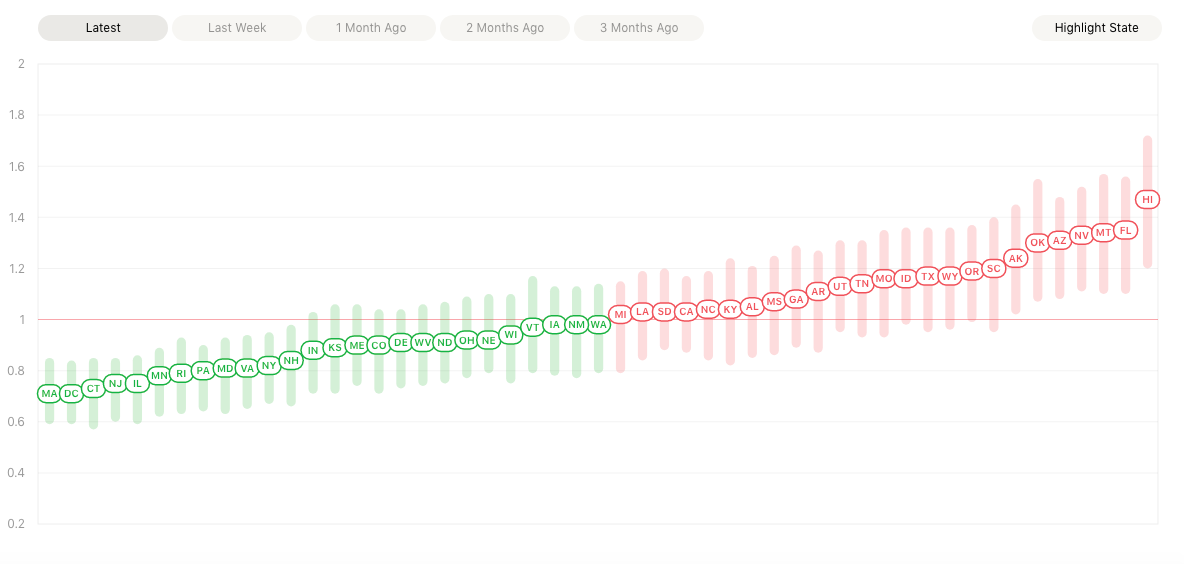
Looks our states are *precisely* balanced between those whose COVID19 transmission rate is >1.0 and those <1.0
Now Mid April:
Here is where we started (April) with about 1/4 of the states
below 1.0. By some measure half the states are better off now
than in the early days of the Pandemic.
But over a month into the lockdown (mid April) we had only 7
(1/7th-ish) states with an Ro>1.0, and all of those under 1.2
(8 infecteds leads to 9 new infecteds). The hammer worked?
Admittedly, *some* of these were simply "late to enter the race"... so *they* are just hitting their stride a month or so after the states with big cities fed by multiple international airports.
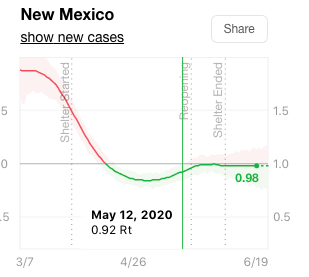
It is interesting (perhaps, to some) to drill down into the individual states Ro Curves and see how they relate to shutdown/open-up dates. Some states like NM seem to have done well implementing *both* the hammer AND the dance...
https://medium.com/@tomaspueyo/coronavirus-the-hammer-and-the-dance-be9337092b56
- .... . -..-. . -. -.. -..-. .. ... -..-. .... . .-. .
FRIAM Applied Complexity Group listserv
Zoom Fridays 9:30a-12p Mtn GMT-6 bit.ly/virtualfriam
un/subscribe http://redfish.com/mailman/listinfo/friam_redfish.com
archives: http://friam.471366.n2.nabble.com/
FRIAM-COMIC http://friam-comic.blogspot.com/
| Free forum by Nabble | Edit this page |