Historic Income Distribution

classic Classic list List threaded Threaded
3 messages Options
Reply | Threaded
Open this post in threaded view
|

Historic Income Distribution

Owen Densmore
Administrator
I've often thought the huge wealth of the top 1% was common, and only became more equitable in the post ww2 era with lots of mfg jobs, GI Bill, Interstate Highway initiative and so on.

I realize that's not very popular, the common notion is that it has been getting worse forever and especially now.

So I happened across this:
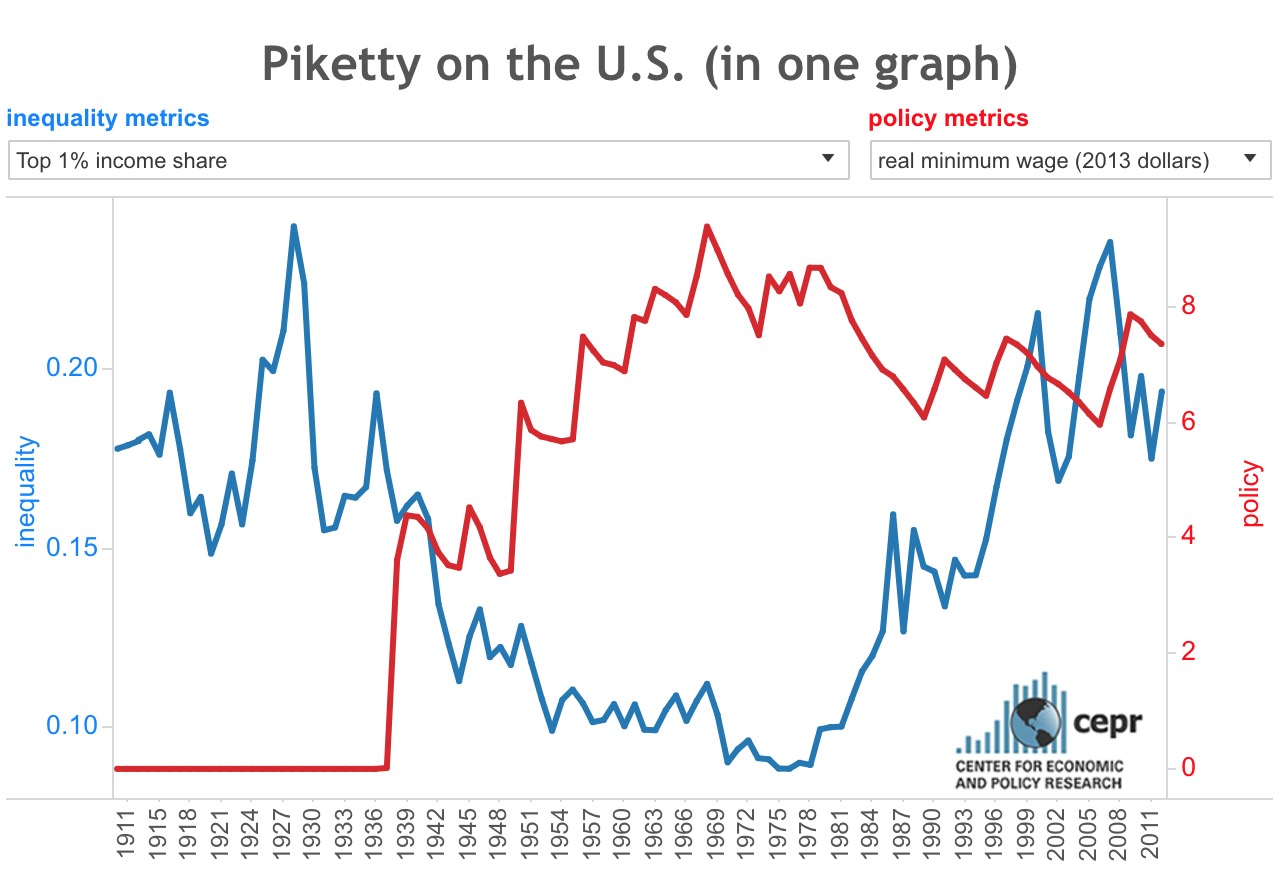
.. with this chart (just look at the blue):
Inline image 1
Sure enough, the Life of Reilly years were saner .. post war to mid 1980s.

It's also interesting to play with the drop-down menus, changing the policy numbers, and the top percentage.

I wonder what periods of human history have also been equitable? Possibly wars? Revolutions?

   -- Owen


============================================================
FRIAM Applied Complexity Group listserv
Meets Fridays 9a-11:30 at cafe at St. John's College
to unsubscribe http://redfish.com/mailman/listinfo/friam_redfish.com
FRIAM-COMIC http://friam-comic.blogspot.com/ by Dr. Strangelove
Reply | Threaded
Open this post in threaded view
|

Re: Historic Income Distribution

Robert Holmes-3
Interesting site, thanks for posting that.

The viz does suffer from the "missing zero" problem: the graph you show (blue line) actually only shows a doubling of the inequality measure (income share of top 1%) from about 0.1 in the 80's to about 0.2 now.

If you want to see how the hyper-wealthy are doing, take a look at top 0.01% of income share including capital gains. They have enjoyed a five-fold (five!) increase in their share in the same period.

On Sat, Nov 12, 2016 at 12:49 PM, Owen Densmore <[hidden email]> wrote:
I've often thought the huge wealth of the top 1% was common, and only became more equitable in the post ww2 era with lots of mfg jobs, GI Bill, Interstate Highway initiative and so on.

I realize that's not very popular, the common notion is that it has been getting worse forever and especially now.

So I happened across this:
.. with this chart (just look at the blue):
Inline image 1
Sure enough, the Life of Reilly years were saner .. post war to mid 1980s.

It's also interesting to play with the drop-down menus, changing the policy numbers, and the top percentage.

I wonder what periods of human history have also been equitable? Possibly wars? Revolutions?

   -- Owen


============================================================
FRIAM Applied Complexity Group listserv
Meets Fridays 9a-11:30 at cafe at St. John's College
to unsubscribe http://redfish.com/mailman/listinfo/friam_redfish.com
FRIAM-COMIC http://friam-comic.blogspot.com/ by Dr. Strangelove


============================================================
FRIAM Applied Complexity Group listserv
Meets Fridays 9a-11:30 at cafe at St. John's College
to unsubscribe http://redfish.com/mailman/listinfo/friam_redfish.com
FRIAM-COMIC http://friam-comic.blogspot.com/ by Dr. Strangelove
Reply | Threaded
Open this post in threaded view
|

Re: Historic Income Distribution

Owen Densmore
Administrator
Now if it actually went back to Columbus, that would be fab!

But I believe it is the case that the post war era was unique. The GI bill was a winner, and naturally all the jobs, including the interstates too.

I'd like to know if there were other such eras anywhere, not just the US.

On Sat, Nov 12, 2016 at 2:53 PM, Robert Holmes <[hidden email]> wrote:
Interesting site, thanks for posting that.

The viz does suffer from the "missing zero" problem: the graph you show (blue line) actually only shows a doubling of the inequality measure (income share of top 1%) from about 0.1 in the 80's to about 0.2 now.

If you want to see how the hyper-wealthy are doing, take a look at top 0.01% of income share including capital gains. They have enjoyed a five-fold (five!) increase in their share in the same period.

On Sat, Nov 12, 2016 at 12:49 PM, Owen Densmore <[hidden email]> wrote:
I've often thought the huge wealth of the top 1% was common, and only became more equitable in the post ww2 era with lots of mfg jobs, GI Bill, Interstate Highway initiative and so on.

I realize that's not very popular, the common notion is that it has been getting worse forever and especially now.

So I happened across this:
.. with this chart (just look at the blue):
Inline image 1
Sure enough, the Life of Reilly years were saner .. post war to mid 1980s.

It's also interesting to play with the drop-down menus, changing the policy numbers, and the top percentage.

I wonder what periods of human history have also been equitable? Possibly wars? Revolutions?

   -- Owen


============================================================
FRIAM Applied Complexity Group listserv
Meets Fridays 9a-11:30 at cafe at St. John's College
to unsubscribe http://redfish.com/mailman/listinfo/friam_redfish.com
FRIAM-COMIC http://friam-comic.blogspot.com/ by Dr. Strangelove


============================================================
FRIAM Applied Complexity Group listserv
Meets Fridays 9a-11:30 at cafe at St. John's College
to unsubscribe http://redfish.com/mailman/listinfo/friam_redfish.com
FRIAM-COMIC http://friam-comic.blogspot.com/ by Dr. Strangelove


============================================================
FRIAM Applied Complexity Group listserv
Meets Fridays 9a-11:30 at cafe at St. John's College
to unsubscribe http://redfish.com/mailman/listinfo/friam_redfish.com
FRIAM-COMIC http://friam-comic.blogspot.com/ by Dr. Strangelove